REFORM UK: THE COST OF THE BORISWAVE

The Conservative Party promised to reduce immigration in four consecutive election manifestos, and were in government after the Brexit vote which was in a large part a message from the British people that they wanted immigration reduced significantly.
What transpired was that the Conservative Party inflicted on the British people one of the greatest betrayals in this country’s history. Between January 2021 and June 2024, Prime Minister Boris Johnson and his Conservative successors issued a staggering 3.8 million long term visas, resulting in gross immigration of 4.8 million and net immigration of 2.6 million.1
Annual net immigration averaged more than double the previous decade - already a period of historically high mass immigration.
These mind boggling numbers do not tell the full story of the catastrophe. It was not just the size, but the composition of the Boriswave that was fundamentally different to previous cohorts of migrants. Economically, just 17% of the Boriswave migrants came to Britain as workers on work visas. Culturally, Britain went from immigration primarily from EU countries, to vastly higher levels of immigration from primarily non-EU countries.
While Boris Johnson is no longer Prime Minister, his poisonous legacy is only just beginning to unfold. In fact, the Boriswave is a ticking fiscal bomb, about to explode. Between 1.6 and 2.2 million Boriswave migrants are now becoming eligible to receive Indefinite Leave to Remain and, shortly after, citizenship.
We have undertaken a detailed bottom up analysis of the Boriswave to cost its long term effect on the economy of the United Kingdom.
EXECUTIVE SUMMARY
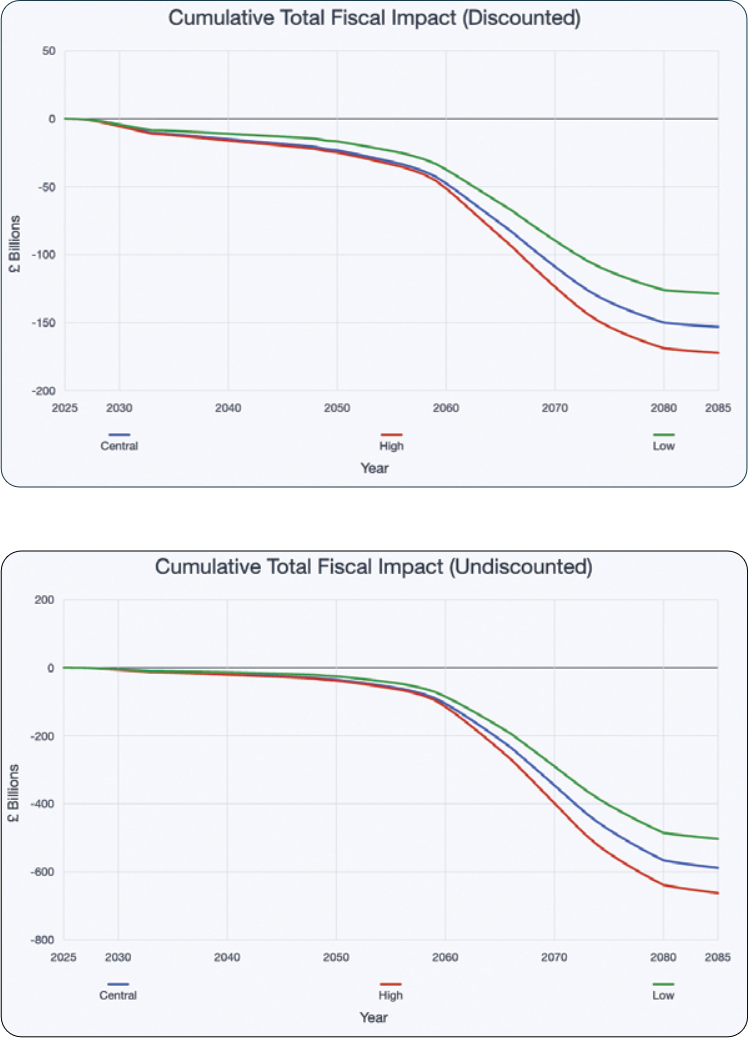
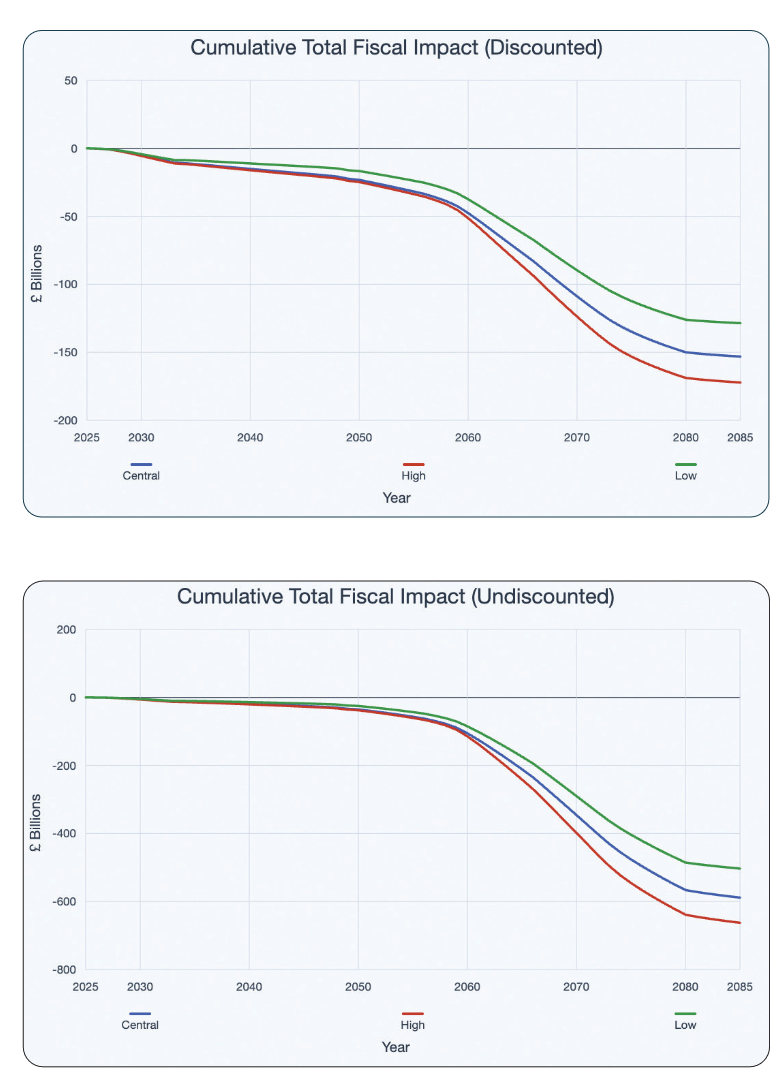
1. The total lifetime cost of the 2021-2025 migrants expected to receive ILR in the years from 2026 to 2030 is roughly £622.5 bn in real terms if undiscounted, and £154 bn if discounted at the 3.5% rate suggested by the HM Treasury Green Book. This total fiscal black hole represents a £20,000 liability for every household in the UK.
2. We run 3 scenarios, predicated on the 3 sets of settlement forecasts issued by the Home Office in conjunction with their Fairer Pathway to Settlement consultation, with the low-case implying 1.30 million settlers between 2026 and 2030, the medium case implying 1.63 million settlers, and the high case implying 2.15 million settlers. The high scenario results in estimated costs of £700 bn undiscounted, and £175 bn after discounting, while the low scenario results in estimated costs of £531 bn undiscounted and £130 bn after discounting.
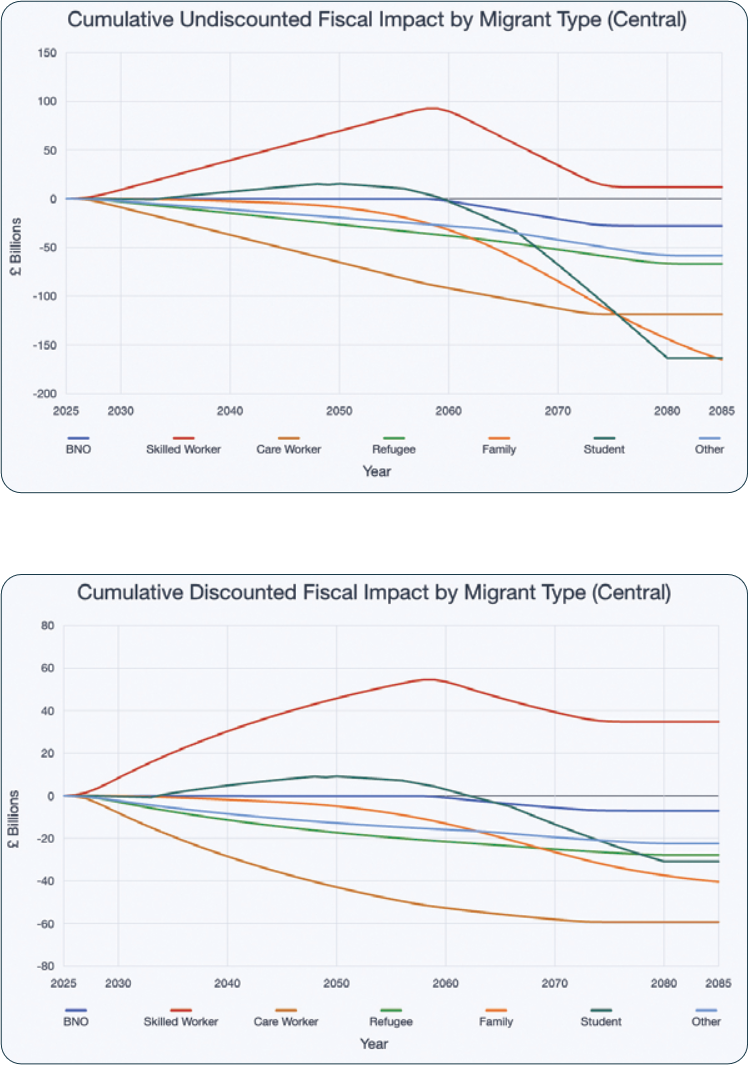
3. The fiscal impact is heavily dependent on the mix of migrants into the country, with skilled workers being the only group to remain fiscally contributory over the course of their lifetimes, while refugees tend to be among the most fiscally onerous.
4. The fiscal incidence ramps up as the cohort ages, retires, and accrues pensions or other forms of old-age benefits.
5. The fiscal impact of the medium and high scenarios remain relatively similar initially with the higher numbers of skilled workers in the high scenario subsidising the rest of the cohort, but which gradually becomes more onerous as they begin to retire.
6. We model fiscal impact as follows:</p> <ol style=">Define migrant cohorts per migrant type in each scenario caseDefine wages as a function of age and migrant type and therefore which quintile of resident earners they fall underDefine their per-capita fiscal impact (direct taxes + indirect taxes - benefits in kind - cash benefits)Aggregate with the population numbers to get their overall fiscal impact
WHAT IS THE REAL COST OF THE BORISWAVE?
METHODOLOGY
Our aim is to model the lifetime fiscal cost of migrants who have arrived from 2021 to 2025, who will increasingly become eligible for Indefinite Leave to Remain (ILR) from 2026 to 2030, giving them recourse to public funds. For the purposes of the costings our analysis used 2021-2025, reflecting the methodology of the Government in its ILR forecasts.
First, let’s define the migrant categories in question that are within the scope of our modelling:
- Health and social care workers
- Refugees and asylum seekers.
- This includes:
a. Asylum and Refugees
b. ACRS other/p3
c. ARAP
d. Discretionary Leave
e. UASC
f. VPRS
g. UKRS
3. BNOs (although BNOs are not affected by our policy response)
4. Student visa holders (transition to other categories before becoming eligible
for ILR)
5. Family visa holders
6. Skilled workers and non-care health workers
7. Other
At the outset we note that fiscal impact really comes down to two things:
- Tax
- Direct/Income Tax (which goes up with wages). This includes
- Income Tax
- National Insurance
- Council Tax
- Indirect Tax (which goes up with spending). This includes:
- VAT
- Tobacco and Alcohol Duties
- Fuel Duties
- Benefits
- Benefits in kind (education, NHS, social care, childcare, housing and travel subsidies)
- Cash benefits (Universal Credit, Child Benefit, Housing Benefit, Personal Independence Payments)
- Capital costs: these are the costs of providing the infrastructure required for public services, eg roads, hospitals, housing, sanitation. Our primary source for 1 and 2 are the reference tables 3A and 4A of ONS Effects of Taxes and Benefits on Household Income 2024.3 Due to lack of microdata on migrant fiscal incidence, we map migrants to ONS income quintiles as a proxy. This likely understates heterogeneity within groups. Accordingly, the primary factor that determines fiscal impact is wages.
Important Note
Since health and social care visas consist of both doctors earning above median UK wages, and care workers earning close to minimum wage, we will model the care workers distinctly as low wage workers, and the rest of the health and social care visas as skilled workers with comparable wage profiles.
Methodology
The general methodology is as follows.
For each migrant type:
1. We will define the migrant cohorts
2. We will model average cohort wages
3. We will model their tax contributions, welfare entitlements. We will split by:
a. Working Age
b. Pension Age: assuming a retirement age of 66 and a life expectancy of 81
4. We will aggregate costs to get a total fiscal impact of the entire cohort
The precise calculations vary across migrant type as a function of the available data.
1. For skilled workers, health and care workers, and BNOs we form synthetic households predicated on dependency ratios and household data where available before matching these average households to the appropriate quintile in the ONS Effects of Taxes and Benefits 2024 dataset. Synthetic households are defined as Migrants/(1+Dependency Ratio).
2. For refugees, we instead mark the per-household data from the ONS down to per-capita numbers.
3. For students and other settlers, we build compound models. Students transition to other visa types before settling in the UK. We use the appropriate transition rates from students to work, either directly or through the graduate visa (which does not itself count towards ILR).
4. For family visas, we rely on the MAC Family visa financial requirements review.4 Wage data, where available, is used to determine household/person income quintiles during the migrant’s working life. We attribute to the retired household the average quintile that the person was assigned to over the course of their lives.
Why are our numbers distinct from those of the Migration Advisory Committee?
The primary source of difference is the lack of additional discounting that the Migration Advisory Committee and the Government generally applies when considering fiscal impact.
The practice is to discount future costs at the rate of 3.5% a year, following guidance in the HM Treasury Green Book.5
This has the effect of highly compressing costs in the far future, in particular pension and Universal Credit liabilities due to the increase in population, and heavily positively weighting current earnings, resulting in fiscal impact numbers that we believe are heavily understated.
The reality is every component of the cost of each migrant will already increase by at least the rate of inflation. In some cases, for example state pensions, they will increase faster than inflation. So discounting liabilities in the future makes no sense if you’re truly aiming to assess the cost of any current policy, including migration policy.
It is worth noting that in the OBR’s Fiscal Risks and Sustainability Report in 2024, there was no attempt made at discounting future costs as the focus was on migration’s impact on deficit and debt.
Are we accounting for the “ramp up” phases of the cohort when aggregating population numbers with per-capita fiscal costs?
Yes. We account for the steady growth in the stock of Boriswavers in each migrant type between 2026 and 2030, cumulatively adding each new cohort of settlers until they are all assumed to have received ILRs.
What about inflation?
Since both costs and contributions are expected to rise at least in line with inflation, we see that discounting them back down gives us precisely the nominal fiscal impact numbers.
That is to say: the undiscounted numbers below are already in real terms.
What about ILR take-up rates?
With the exception of the section on students, we rely exclusively on ILR grant rates issued by the Home Office themselves in their Fairer Pathway to Settlement whitepaper.
Therefore, regardless of the Boriswave itself, we are modelling the fiscal cost of those who the government themselves expect to remain here in this country.
Aren’t you confusing marginal fiscal costs with average costs of the base population?
There is no clean estimate of marginal costs ratified by the Government, but we believe, given the fact that:
a. UK public services are highly capacity constrained
b. Infrastructure investment and capital stock growth has been anomalously low in the UK for decades
That, if anything, the marginal cost of an additional person actually exceeds the average cost of the baseline population making these numbers under-estimates of the fiscal incidence.
What about wage lifts over the lifetimes of earners?
We account for this in two ways depending on the type of migrant.
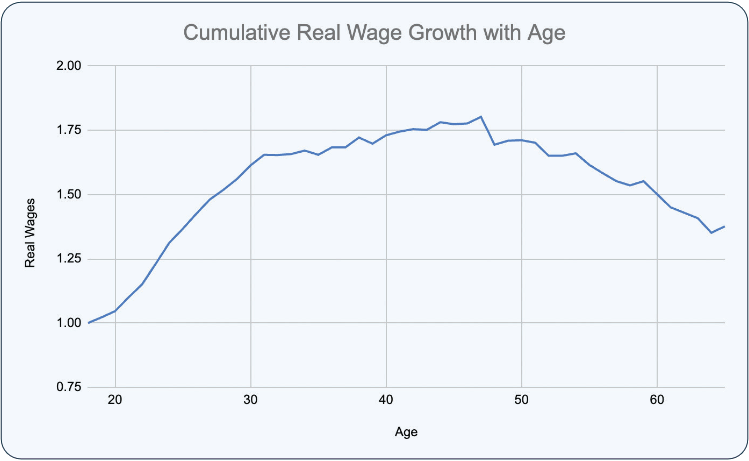
For skilled workers and BNOs, we assume that wages evolve dynamically across lifetimes in accordance with the average profile of wage growth as a function of age as published by the ONS’s Journeying through Modern Life report indicating peak earnings at 47 years of age.6
For low-wage workers earning close to minimum wage (for example care workers, refugees, and those arriving on family visas), we assume a real wage growth in line with that of median wage growth in this country. Data from the care sector indicates no meaningful experience premium: i.e. wages do not grow commensurately with experience as they do in other parts of the economy.
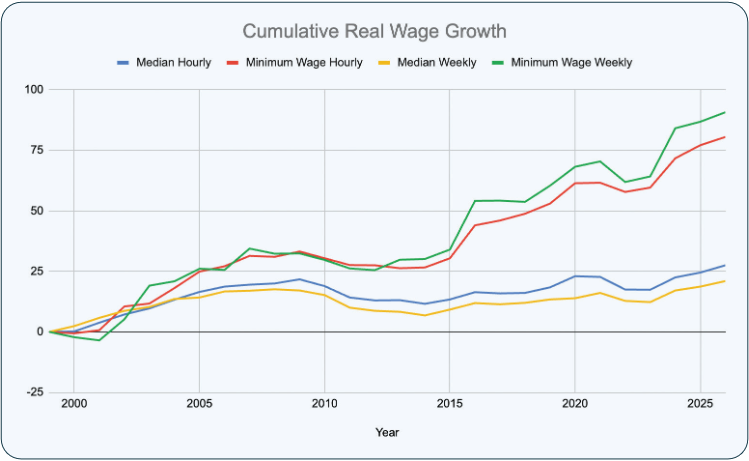
Even though minimum wages have grown much faster than median wages in real terms in the last two decades, the Low Pay Commission indicates that median wages are to be kept in line with 66% of median wages.7
While they were historically much lower (accounting for the fast growth in recent years), median wages are now 65% of median wages.
Therefore, we note that minimum wages will continue to rise by 0.7% annually in real terms, in line with median wages.
Why do we impose the average working life quintiles to retirement?
Wages lift and drop over the course of a person’s lifetime which affects their ordinal placement relative to other workers, but which shouldn’t affect their placement among other retirees.
For instance, if a skilled worker household generally in the 4th quintile is nearing retirement, and drops below the 4th quintile relative to the working age population, then it is unreasonable to believe that they will remain there after retirement; more likely they will remain in the 4th quintile relative to other retired households.
CARE WORKERS
Cohort Definition
1. 62% of all health and social care visas went to care workers specifically, and 38% of these visas went to doctors and nurses.8
2. For those on health and care visas, the household roughly looks like:
- Main applicant: 1 adult
- Adult dependants: 0.66 adults (nearly always spouses)
- Child dependants: 0.74
3. That gives us a dependency ratio of 1:1.4
4. 47% of all visas issued to dependents were given to adults. In the baseline case, the number of people who arrived on health visas as carers or adult dependants of carers is:
| Route | 2026 | 2027 | 2028 | 2029 | 2030 | Total |
|---|---|---|---|---|---|---|
| Health and Care Worker | 47,000 | 104,000 | 210,000 | 70,000 | 32,000 | 463,000 |
| Carers Only | 29,140 | 64,480 | 130,200 | 43,400 | 19,840 | 287,060 |
| Carer Main | 12,142 | 26,867 | 54,250 | 18,083 | 8,267 | 119,608 |
| Carer Dependants | 16,998 | 37,613 | 75,950 | 25,317 | 11,573 | 167,452 |
| Carer Adult Dependants | 7,989 | 17,678 | 35,697 | 11,899 | 5,439 | 78,702 |
| Carer Adults | 20,131 | 44,545 | 89,947 | 29,982 | 13,706 | 198,311 |
Average Wages
1. Social care incomes are heavily compressed against the legal minimum. According to Skills for Care, 2024, 60% of all care workers received a pay rise in April 2024 because they were previously below the new minimum wage.9
2. Hourly wages were about £12.20/hour in 2025, close to the minimum wage paid precisely at the minimum wage.
3. As of 2024, the difference in pay between a social care worker with 5 years of experience and somebody with 1 year of experience was 0.04p. This means that nearly all careworkers can be modelled to make <= £12.71/hour.
4. Since wages are so low, and the dependency ratio of 1:1.4 is so high, there is a heavy reliance on welfare.
Per Capita Fiscal Impact
In order to compute per-capita fiscal impact, we need to:
1. First, form the synthetic households predicated on the dependency ratio.
2. Given the dependency ratio is 1:1.4, and further that for every 1 adult, we have 0.66 adult dependants, we then account for the incomes of the dependants published by the Home Office, as well as the dependants employment rates per visa category.11
3. This gives us care workers household total income in a given year.
4. We then inflate this number by average real wage growth for this income quartile (roughly 0.7% a year as discussed above), and then get to a household income number a year every year in the future.
During working life, a starting income of £23,500/year generally puts these households in the 2nd quintile of earners resulting in:
Age |
Work or Retirement |
Care Workers Wages |
Direct Taxes |
Indirect Taxes |
Cash Benefits |
Benefits-in- Kind |
Net Fiscal Impact |
|---|---|---|---|---|---|---|---|
| 35 | Work | 23,500 | 8,156 | 6,556 | 8,545 | 18,416 | -12,249 |
| 67 | Retirement | 6,330 | 2,018 | 5,916 | 16,288 | 11,858 | -20,212 |
Aggregate Fiscal Impact
1.Given that:
- turnover rates are close to 25%, and12
- most importantly, that you could take home more on welfare than just by working
2. The latest statistics on average age of settlers in the UK (Table SE_D03) show that the median age of an adult settler is about 35 years old13
3. This gives us (66 - 35) = 31 working years and (81-66) = 15 retired years.
4. We have 198,311 adults in the entire cohort.
5. For capital costs, we lift the £20,000 per person one-off number and multiply it by the number of adults. (Again, this is an underestimate, since we could model the children here with realistic social mobility assumptions, more broadly.)
In each of the 3 scenarios, we get:
In the Central Scenario, Care Workers then amount to a total fiscal cost of £121bn in real terms, and £59 bn after discounting. In the High Scenario, the costs are £180 bn and £88.5 bn after discounting, and in the Low Scenario, the costs are £88 bn and £47 bn after discounting
REFUGEES
Cohort Definition
| Route | 2026 | 2027 | 2028 | 2029 | 2030 | Total |
|---|---|---|---|---|---|---|
| Asylum | 19,000 | 24,000 | 29,000 | 33,000 | 31,000 | 136,000 |
From the latest Asylum Statistics, we see that 20% of these are dependants.14
Average Wages
1. The Refugee Integration Outcome Report from 2025 indicates that employment among refugees plateaus at 48% after two years.15 A significant portion, 52%, remain non-employed.
2. The median full-time gross annual wage for employed refugees is £23,500, close to minimum wage in 2025, as with care workers.
3. Crucially, nearly all employed refugees earn below £28,500.
Given observed wage distributions, and low rates of employment, we assign most refugees to the bottom income quintile among the population.
Per-Capita Fiscal Impact
Given refugee average wages, we are able to model them as being in the lowest quintile in the country on average. For households, this would amount to:
| Age | Work or Retirement |
Refugee Wages |
Direct Taxes |
Indirect Taxes |
Cash Benefits |
Benefits-in- Kind |
Net Fiscal Impact |
|---|---|---|---|---|---|---|---|
| 24 | Work | 12,572 | 4,234 | 5,054 | 9,345 | 23,508 | -23,565 |
| 67 | Retirement | 3,676 | 2,366 | 5,051 | 11,327 | 13,455 | -17,365 |
We re-scale this by the average household composition to proxy per-capita costs.
Aggregate Fiscal Impact
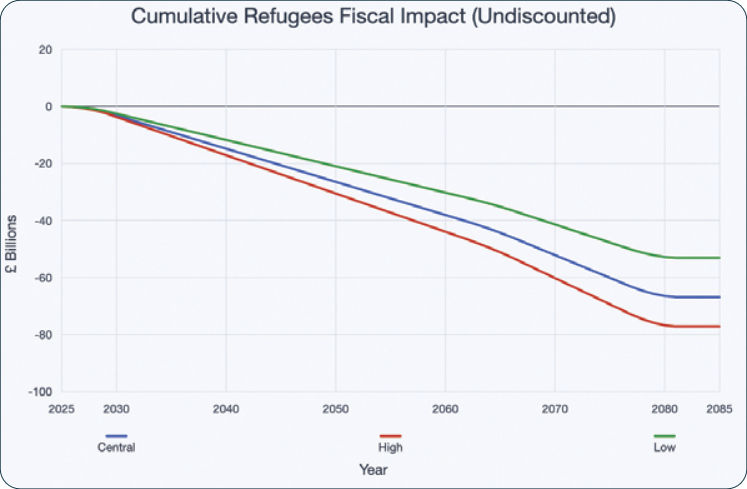
We have 280,000 refugees. From Table B of the Refugee Integration Outcomes, we estimate the average refugee age to be 29 years old.
This gives us (66-29) = 37 years of working life and (81-66) = 15 years of old age. In the Central Scenario, this gives us a total of -£67 bn, and -£28 bn after discounting.
SKILLED WORKERS
Cohort Definition
| Route | 2026 | 2027 | 2028 | 2029 | 2030 | Total |
|---|---|---|---|---|---|---|
| Skilled Worker | 42,000 | 73,000 | 75,000 | 74,000 | 42,000 | 306,000 |
| Non-care Health Worker |
17,860 | 39,520 | 79,800 | 26,600 | 12,160 | 175,940 |
| Total | 59,860 | 112,520 | 154,800 | 100,600 | 54,160 | 481,940 |
1. To get the health (non-care) workers, we take the total number of health and care visas and note that 62% of all visas were given to care workers specifically.
2. From the Home Office’s Monthly Visa Clearances, we see that there are about 0.86 dependants per main applicant.16
3. From the Skilled Worker Early Insights paper, we have the average age of skilled worker visa applicants to the UK as 34 years old.17
Average Wages
1. Health workers who are not in care work will be modelled to have comparable salaries to those who are skilled workers.
2. From the sponsored worker and family visa earnings, we see that the median skilled worker earns £56,600 a year, and their adult dependants earn £30,200 a year.18 We further see that skilled worker dependants have employment rates lower than those of main applicants by a ratio specified there. If 75% of skilled workers had PAYE earnings, then 45% of their dependants did.
Per-Capita Fiscal Impact
As in the case of the care workers, in order to compute per-capita fiscal impact, we need to:
1. First, form the synthetic households predicated on the dependency ratio.
2. Given the dependency ratio is 1:0.86, and further that for every 1 adult, we have 0.43 adult dependants, we then account for the incomes of the dependants published by the Home Office, as well as the dependants employment rates per visa category.19
3. From the MAC Fiscal Report 2025 underlying data, we get the employment rates by age of skilled workers.
4. Finally, we also account for the real wage variation with age specified in the ONS’s Journeying through Modern Life report.20
5. Putting this together gives us an estimate of annual, dynamic household incomes for skilled worker households into the future.
At the household level, this maps into the fourth quintile on arrival (although this changes dynamically as wages lift and fall over the course of the household’s life):
| Age | Work or Retirement |
Direct Taxes | Indirect Taxes | Cash Benefits | Benefits-in- Kind |
Net Fiscal Impact |
|---|---|---|---|---|---|---|
| 34 | Work | 19,615 | 8,663 | 4,025 | 12,599 | 11,654 |
| 67 | Retirement | 2,549 | 5,055 | 19,081 | 13,550 | -25,027 |
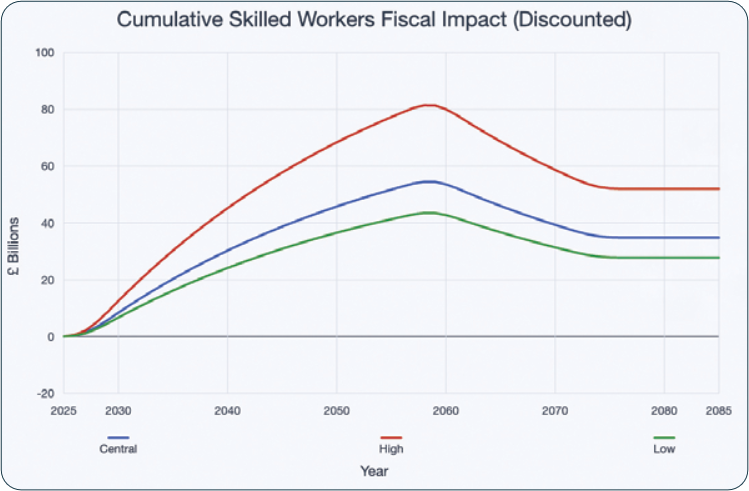
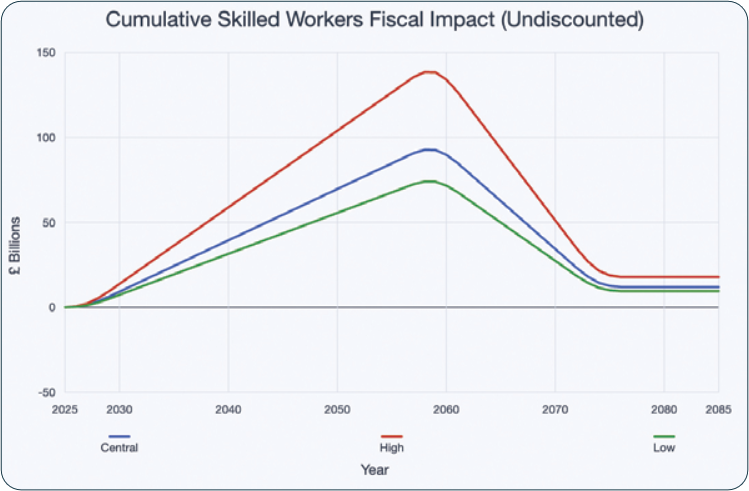
Salaries grow quickly in a worker’s thirties, peaks in their mid-forties, and steadily plateaus and slightly declines as they age.
Skilled Workers remain fiscally positive, contributing £12.2 bn in total, and £34.8 bn after discounting in the Central Scenario. In the High Scenario, the contributions are £18.2 bn and £52 bn after discounting, and in the Low Scenario, the contributions are £9.7 bn and £27.8 bn after discounting.
Aggregate Fiscal Impact
FAMILY VISA HOLDERS
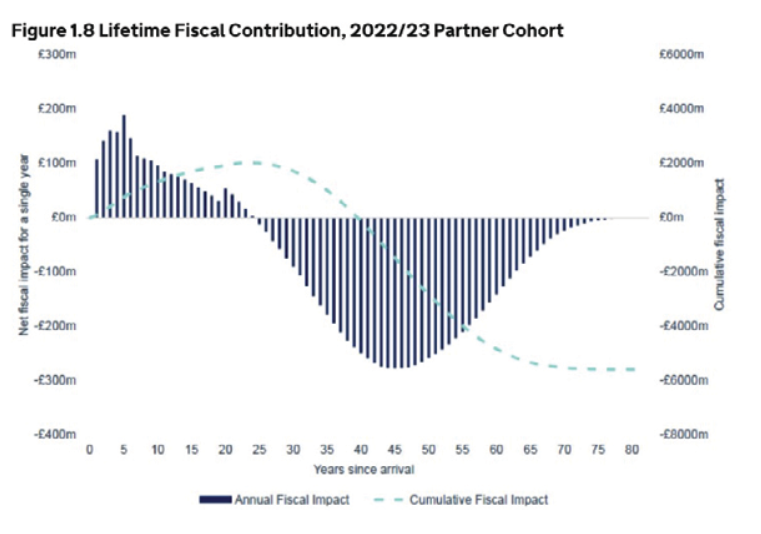
The Migration Advisory Committee published some analysis in December 2025 estimating the fiscal impact of the family visa.21 They estimate a lifetime cost of £109,000 per person after the heavy discounting specified by the HM Treasury Green Book. For the 2022/23 cohort, the Migration Advisory Committee arrives at a total number of £5.6bn in costs.
We echo their analysis for per person costs.
Cohort Definition
The Home Office estimates the following number of ILRs granted to family visa holders:
| Migrant Route | 2026 | 2027 | 2028 | 2029 | 2030 | Total |
|---|---|---|---|---|---|---|
| Family Visa Holders | 40,000 | 46,000 | 60,000 | 66,000 | 68,000 | 280,000 |
1. Note that within 10 years of arrival, over 82% of family visas receive their ILRs. (Migrant Journey 2024 Report).22
2. Additionally, the MAC Annual Report highlights that their average age is about 33.23
Average Wages
The primary drivers of negative fiscal impact according to the MAC Report are:
1. The MAC specifies an employment rate of 49% for partners, heavily driven by females; the UK female employment rate is 72%, for contrast.
2. Mean salaries were £21,000 for the 2022/23 cohort. Note that salary requirements for family/spousal visa sponsors is now £29,000 a year, but was just £18,600 a year until 2024.24
3. Costs ramp up drastically in old-age. From the report: “As the cohort ages further, the annual fiscal contribution becomes negative. This is a result of both declining employment income, as the cohort ages into ill-health
and retirement, and the rising level of public spending allocated to them (particularly health, social care and state pension).”
Given the MAC Analysis, we simply lift their per-capita lifetime fiscal costs of £109,000 after discounting, and undiscounted, we have a staggering cost of -£741,000 per person.25
Aggregate Fiscal Impact
Given the 280,000 migrants, and the MAC’s estimates of cost per migrant, we get a total cost of £186 bn undiscounted and £43 bn after discounting. In the High Scenario, we get £202.9 bn undiscounted and £45.7 bn after discounting. In the Low Scenario, we get £152 bn undiscounted and £34 bn after discounting.
STUDY VISA HOLDERS
Cohort Definition
Student years do not generally qualify towards the current 5 years needed to be in the UK for ILR. Instead, students generally switch to either:
1. Graduate visas
2. Work visas (skilled or health and care)
In fact, from the Home Office:26
1. Total asylum claims: 100,625
2. Study visa: 12,578 (32% of visa-overstay claims)
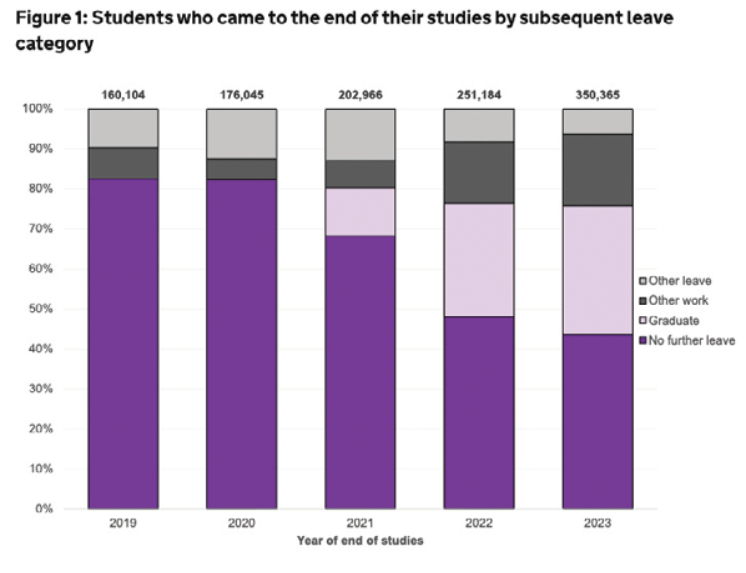
This is also seen in the average length of the length of study leave decreasing drastically over this period i.e. study visas were increasingly being issued to students studying shorter courses. 69% of graduate visas in 2023 were issued to people studying for a year or less, compared with 39% in just 2021.
Now, note that the Home Office provides the following ILR rates among those who were initially granted student visas in their Fairer Pathway to Settlement Whitepaper:
| Migrant Route | 2026 | 2027 | 2028 | 2029 | 2030 | Total |
|---|---|---|---|---|---|---|
| Study | 16,000 | 17,000 | 21,000 | 25,000 | 26,000 | 105,000 |
However, most of the student visas issued during the Boriswave will not be eligible for ILR during the period from 2026-2030, and since we’re interested in the terminal or ultimate fiscal impact of the student visas issued during the Boriswave, we will rely on the migrant journey numbers instead. Most of the students who came during the Boriswave will receive ILR later than 2030 and so will not be captured by the forecasts above. In order not to double count, we will omit the numbers above entirely and focus instead on the visas approved during the period that could result in settlement between 2026-2030, namely, 2020-2025.27
Note: It is important to note that the Migrant Journey 2024 clarifies that fewer than 1% of students receive ILR within 5 years, and that in the Migrant Journey 2022 we see that fewer that 5% were granted ILR within 10 years, with the number jumping to 10% within 12 years. Student visa cohorts tend to settle slowly, and there is not going to be significant overlap with the settling cohorts of other migrant types.
Given the total population of students who arrived between 2020 and 2025, we have:
| Year | 2020 | 2021 | 2022 | 2023 | 2024 | 2025 | Total |
|---|---|---|---|---|---|---|---|
| Study Visas Issued |
268,000 | 428,000 | 484,000 | 446,000 | 393,000 | 426,000 | 2.45m |
Note, from the Home Office’s Graduate Visa Review, we have 32% of international students going on graduate visas, and 18% moving directly to work visas. Of these 18%, about 50% historically moved to health and social care visas.28
Accordingly, we do this in two stages. Firstly, looking at graduate visas, we see:
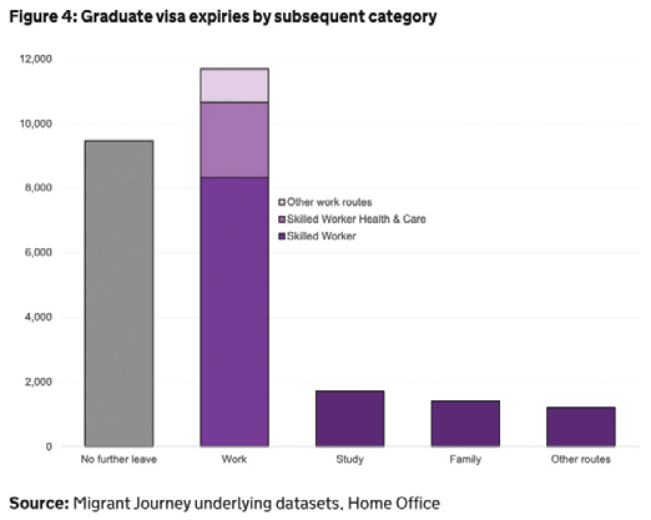
So, these are the transition rates from graduate visas to other routes.
Secondly, we account for the 18% of students transitioning directly to work routes, of whom, about half moved into care work or other low-wage professions.
This gives us the total flow of students into other migrant categories in the future. In order to then further determine how many of these will likely get ILR, we need to account for the transition rates between each of these visa types and the ILR.
Note: There does not exist any cohort data for health and social care visa holder transition rates to ILR since the visa category was only introduced in 2022. We model them by carrying over the skilled worker visa rates (~25%) and marking them upwards a bit due to high dependency rates, and the fact that the nationality mix of care workers tends to skew more towards developing, non-EEA nations relative to skilled workers.
For asylum seekers, although, in order to assess the probability they get ILR, we have to multiply the probability they are granted asylum (48% initially and then 75% of those rejected then appeal, and 33% of those are then approved, giving us a general approval rate of about 65%) and then the probability that they then receive ILR subsequently after (88% from the Migrant Journey 2024).30 For family visas, we cite the Migration Observatory Briefing on Family Migration.31
Once we have the ILR probabilities, we multiply by the visas issued to get the expected number of settlers:
| Route ILR | Probability |
|---|---|
| Skilled Work | 25% |
| Care Work | 30% |
| Asylum | 57% |
| Family | 77% |
Average Wages
We can model this in 2 ways.
Option A
Note the high % of graduates ending up in health and social care or low wage administrative jobs:
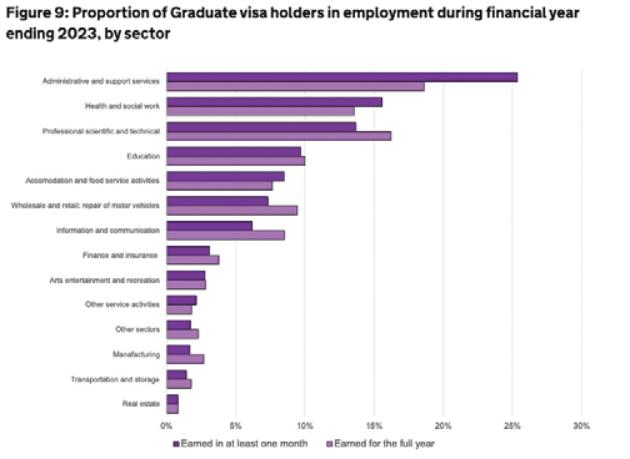
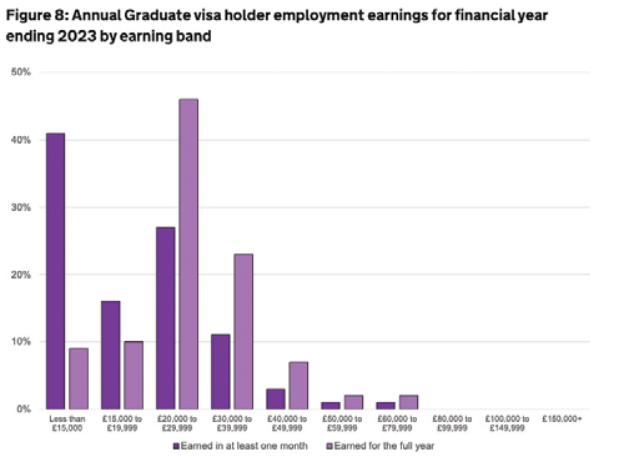
| Income Range | Share (%) |
|---|---|
| Less than £15,000 | 9% |
| £15,000–£19,999 | 10% |
| £20,000–£29,999 | 46% |
| £30,000–£39,999 | 23% |
| £40,000–£49,999 | 7% |
| £50,000–£59,999 | 2% |
| £60,000–£79,999 | 2% |
This gives us a weighted average wage of about £28,000 a year. For further realism, we mark everybody making less than 30k a year (65%) to belong to the bottom two quantiles of the earnings distribution (comparable to the way we modelled care workers), and those making above £30,000 a year (35%) as belonging to the fourth quintile of the population (comparable to the way we modelled skilled workers).
Option B
Another way would be to simply lift the per-capita fiscal incidence from the corresponding other categories, i.e. skilled work, asylum seekers, family.
For consistency and composition with the rest of the model, we pick Option B.
Per-Capita Fiscal Costs
As aforementioned, rather than treating former students as a separate fiscal entity, our model recognises them as a composite cohort, shaped by the various settlement pathways they transition into before ultimately securing permanent status in the UK. To determine the per-capita net fiscal impact for this group at every age, we calculate a weighted average based on four specific downstream routes:
1. Skilled workers
2. Health and care workers
3. Refugees and asylum
4. Family visa holders
These weights are defined by the transition shares defined above and each share inherits the computed per capita lifetime fiscal impact of each of the previously modelled routes.
As before, we separately model working and retirement age.
Aggregate Fiscal Impact
From the Home Office Graduate Route evaluation, the average age of graduates is 26.
This gives us (66-26) = 40 years of working life, with (81-66) = 15 years of old age.32
Putting this together, we have (66-26) = 40 years of working life, and (81-66) = 15 years of elderly fiscal costs, across a cohort of 636,854 settlers.
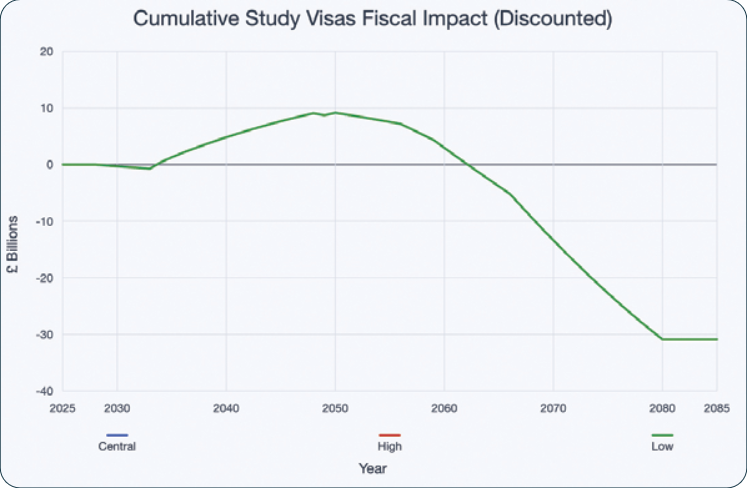
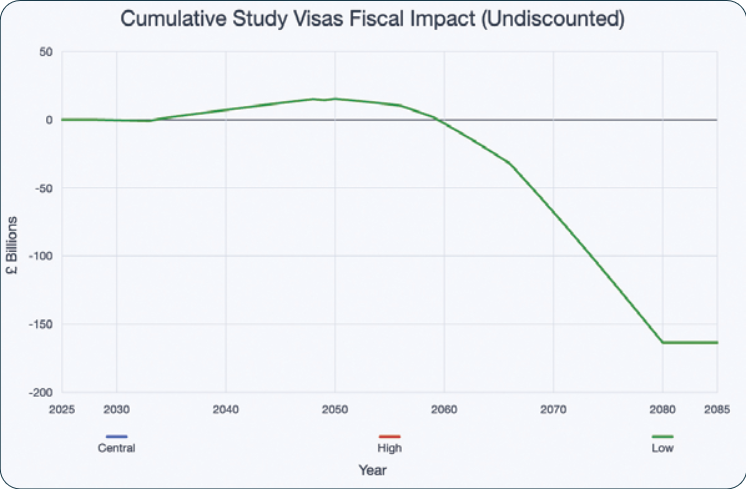
This amounts to a fiscal cost of £167bn in real terms, and £30.9bn after discounting.
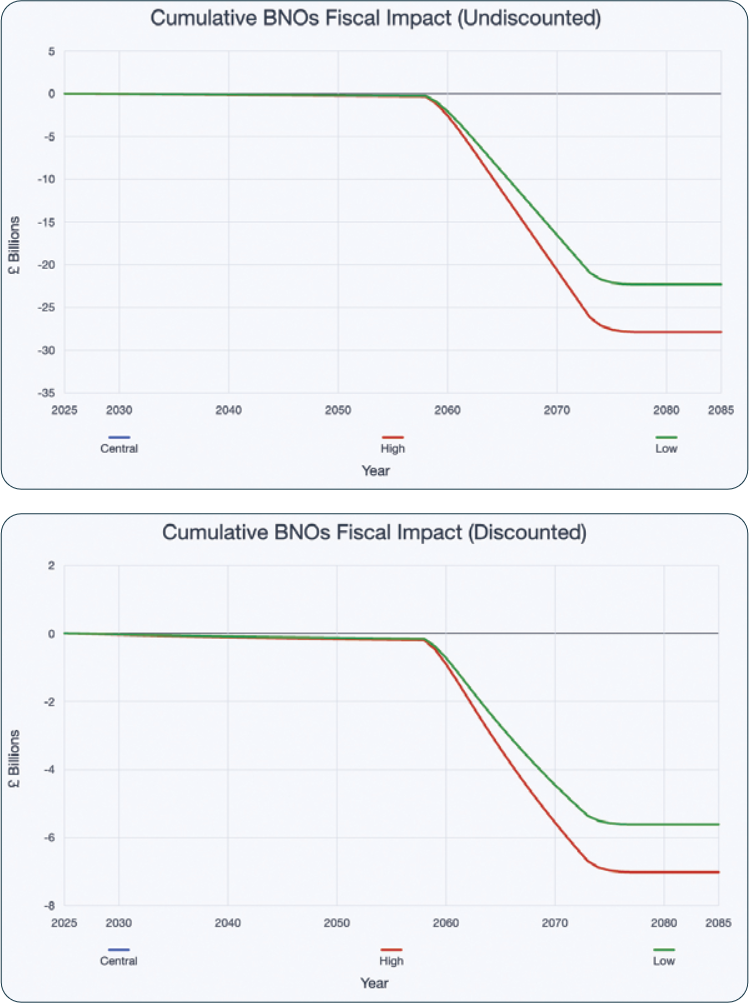
BNOS
Cohort Definition
- The British National (Overseas) (BNO) visa route was established on 31 January 2021, providing BNO status holders and their families a 5-year pathway to Indefinite Leave to Remain (ILR) with full work rights immediately upon arrival. The first cohorts who arrived in January 2021 became eligible for ILR from January 2026.
- The total cohort with an ILR pathway covering the 2021-2026 period is estimated at approximately 195,000 main applicants and dependants.
- The average age of the BNO applicant is 33 years old.
Average Wages
1. The BNO cohort presents a mixed skill profile, with estimated median earnings ranging from £35,000 to £38,000, which is near the overall UK median of £37,430. However, the high geographic concentration of BNO visa holders:
estimated at 60-70% in London and the South East, significantly erodes real wages due to the extreme cost of living creating a “cost-of-living trap”.33
2. Data from the Hong Kong BNO Migrants Panel Survey, which tracks both main applicants and their dependants, reveals a troubling employment rate of just 59%: a figure that is historically low for a cohort of this nature.34
Per Capita Fiscal Impact
1. We infer average BNO household composition from the 2021 Survey of Hong Kong BNO visa holders. This gives us 0.802 adult dependants, and 0.854 child dependants per main applicant.35
2. Dividing the total number of people by the household composition gives us an estimated 72,000 households.
3. Accounting for the average wages and being conservative, we see that most BNO households generally fall into the 3rd quintile of earners in the country.
4. The MAC itself infers that BNOs will likely have a fiscal impact comparable to skilled worker dependents, which offers additional credence for the numbers just above.36
5. Their earnings are once again inflated by the real wage growth rate.
Aggregate Fiscal Impact
The aggregate lifetime fiscal cost for the entire cohort of 195,000 people in the central and high scenarios is estimated at £27.9 bn undiscounted, or £7 bn when discounted, indicating a net fiscal contribution. In the low scenario, we estimate the impact to be £22.3 bn undiscounted or £5.6 bn discounted.
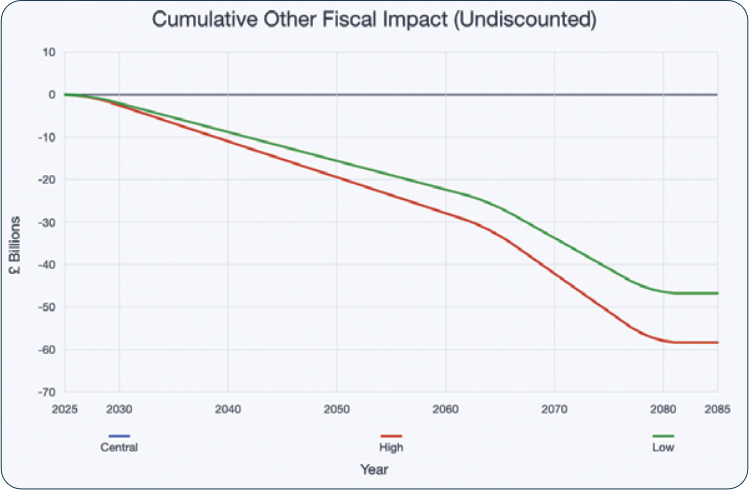
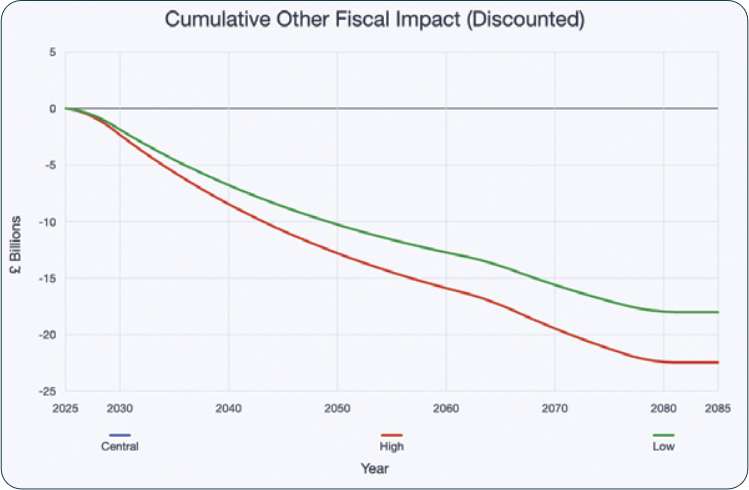
OTHERS
Cohort Definition
In the baseline scenario, the number of individuals receiving ILR via these residual routes is estimated as follows:
| Route | 2026 | 2027 | 2028 | 2029 | 2030 | Total |
|---|---|---|---|---|---|---|
| Other | 29,000 | 28,000 | 28,000 | 28,000 | 28,000 | 141,000 |
1. The “Other” category serves as a residual settlement bucket, capturing those individuals who do not fall neatly into the Home Office’s primary modelled groups. Rather than treating this as a distinct visa type with its own independent wage profile, we model it as a composite of various underlying settlement pathways, similar to the student visa section.
2. In order to determine the composition of this group, we look at the Home Office’s Migrant Journey table MJ_D02 and consider the 15 year historical rate of “Other” visa holders with respect to their initial visa type. This gives us the following weights:
- 46.4% refugee
- 23.0% family
- 23.8% student
- 6.8% work
Average Wages
Because this category is not a coherent, standalone migrant type, it possesses no independent wage anchor. Its effective earnings capacity is instead inherited from the weighted profiles of its constituent routes. Specifically: the refugee share inherits the refugee per-capita profile, the family share inherits the family profile, and so on.
With the majority of the “Other” category comprising of refugee, and family pathways, the group’s weighted earnings capacity remains structurally weak, ensuring a negative fiscal impact even without a dedicated low-wage anchor.
Per Capita Fiscal Impact
To determine the per-capita fiscal impact, we treat the route as a compound
proxy derived from a weighted average of four underlying fiscal profiles:
Other per-capita impact(age) = 0.464 × Refugee impact(age) + 0.230 × Family impact(age) + 0.238 × Student impact(age) + 0.068 × Work impact(age)
During working life, each component is valued at its age-specific per-capita impact; upon retirement, the cohort transitions to the retirement values embedded within those component routes. These are then aggregated into representative working-age and retirement values consistent with the rest of the model.
Aggregate Fiscal Impact
The aggregate lifetime fiscal impact is calculated by applying this weighted per-capita cost to the 2026–2030 “Other” settler cohorts. We model these flows through working life and retirement, discounting future liabilities at the standard 3.5% rate where applicable.
This gives us a cost of £58.3 bn undiscounted, £22.5 bn discounted in the Central and High Scenario, and £46.7 bn undiscounted and £18.0 bn discounted in the Low Scenario.
Putting this all together
| Settlement Scenario | Total Lifetime Cost (Real Terms) |
Total Lifetime Cost (Discounted) |
|---|---|---|
| Low Scenario | -£530.8 bn | -£130.4 bn |
| Central Scenario | -£622.2 bn | -£155.5 bn |
| High Scenario | -£699.3 bn | -£174.7 bn |
POLICY RESPONSE
Starmer is about to U-turn again - should he do so, more than half of the Boriswave will already have become citizens by 2029, baking in these astronomical costs.
In the Home Office’s November 2025 consultation on ‘A Fairer Pathway to Settlement’, Home Secretary Shabana Mahmood consulted on a new model of ‘earned settlement’ that would retrospectively extend the time before Boriswave38 migrants were eligible for ILR.37 The default qualifying period would be extended from five to ten years, with shorter and longer periods for some groups depending on their contribution. However, these changes have not yet been made to the Immigration Rules and it is being widely reported that Starmer is planning to U-turn. Should he do so, the majority of the costs in this analysis will be baked in, permanently altering the fiscal future for British people.
Reform will Abolish ILR
Reform will abolish ILR as an immigration category completely, meaning no new awards and those currently holding it will have it rescinded.38 Reform will replace ILR a with a 5-year renewable visa, subject to considerably stricter criteria, bringing the UK in line with comparators like the UAE. Anyone currently with ILR will need to reapply for visas that do not offer recourse to welfare. Requirements will include:
• Much higher salary thresholds (based on a verified job offer or averaged over the 5-year period in case of renewal), with the right to bring dependants tied to thresholds that will be above median UK earnings.39
• Stricter rules around good character, covering deception (around their visa application), financial misconduct, tax compliance and criminal convictions, all of which will be more rigorously checked via biometric information.
• A much higher standard of English.
There will also be an Acute Skills Shortage Visa available for those working in national critical sectors such as care. For each of these visas issued, a commensurate training place for a British worker will be created, thus ensuring immigration will no longer be needed to fill such roles in the future. There will also be a special route for spouses of British nationals, as well as world class entrepreneurs and large investors. Our policy will not affect BN(O)s or those on the Ukrainian schemes.
Reform will also increase the minimum qualifying period for British citizenship to
7 years.
The process for rescinding grants
The Home Secretary already has powers to strip people of their leave to remain, for example under section 76 of the Nationality, Immigration and Asylum Act 2002. However, this anchors on them being liable for removal or deportation, which will not be the case for all individuals losing ILR. Further, these powers are heavily constrained by public law, the European Convention on Human Rights (ECHR, as it is applied in English law via the Human Rights Act 1998) and domestic immigration law.
Reform is already committed to leaving the ECHR (and derogating from or leaving other international conventions that impede border security), repealing the Human Rights Act and passing the Illegal Migration (Mass Deportation) Bill. This already represents a comprehensive rejection and reversal of the Blairite legal frameworks that have enabled uncontrolled mass legal and illegal immigration. As part of these changes, we will - by primary legislation - abolish ILR. New visa categories and thresholds will in parallel be implemented via the Immigration Rules. Using transitional provision, this will be done on a staggered and orderly basis.
In short, the Boriswave is a generational fiscal catastrophe about to befall Britain. Reform will avert it.
REFERENCES
1. ONS: https://www.ons.gov.uk/peoplepopulationandcommunity/populationandmigration/
internationalmigration
2. Ukraine schemes are excluded as they don’t offer a direct path to ILR.
3. https://www.ons.gov.uk/peoplepopulationandcommunity/
personalandhouseholdfinances/incomeandwealth/datasets/
theeffectsoftaxesandbenefitsonhouseholdincomefinancialyearending2014
4. https://www.gov.uk/government/publications/family-visa-financial-requirements-review/
family-visa-financial-requirements-review-accessible
5. https://www.gov.uk/government/publications/the-green-book-appraisal-and-evaluation-in-
central-government
6. https://www.ons.gov.uk/peoplepopulationandcommunity/populationandmigration/
populationestimates/articles/milestonesjourneyingthroughmodernlife/2024-04-08
7. https://www.gov.uk/government/publications/the-national-minimum-wage-in-2026
8. https://www.gov.uk/government/publications/estimated-lifetime-net-fiscal-costs-for-care-
workers-and-their-adult-dependants/estimated-lifetime-net-fiscal-costs-for-care-workers-and-
their-adult-dependants
9. https://www.skillsforcare.org.uk/Adult-Social-Care-Workforce-Data/workforceintelligence/
Reports-and-visualisations/National-information/The-State-of-report.aspx
10. https://www.skillsforcare.org.uk/Adult-Social-Care-Workforce-Data/workforceintelligence/
resources/Reports/Topics/Pay-in-the-adult-social-care-sector-in-England-as-at-
December-2024.pdf
11. https://www.gov.uk/government/publications/sponsored-work-and-family-visa-earnings-
employment-and-income-tax/sponsored-work-and-family-visa-earnings-employment-and-
income-tax;https://www.theguardian.com/uk-news/2025/sep/14/what-do-the-immigration-
figures-for-the-uk-really-show
12. https://www.skillsforcare.org.uk/Adult-Social-Care-Workforce-Data/workforceintelligence/
Reports-and-visualisations/National-information/The-State-of-report.aspx
13. https://www.gov.uk/government/statistical-data-sets/immigration-system-statistics-data-
tables
14. https://assets.publishing.service.gov.uk/media/69958f76b33a4db7ff889d43/asylum-claims-
datasets-dec-2025.xlsx
15. https://www.gov.uk/government/publications/refugee-integration-outcomes-rio-insights
16. https://www.gov.uk/government/statistics/monthly-entry-clearance-visa-applications-
february-2026
17. https://www.gov.uk/government/publications/evaluation-of-the-future-borders-and-
immigration-system-early-insights-research-with-skilled-workers-and-employer-sponsors/
skilled-worker-visa-early-insights-evaluation
18. https://www.gov.uk/government/publications/sponsored-work-and-family-visa-earnings-
employment-and-income-tax/sponsored-work-and-family-visa-earnings-employment-and-
income-tax
19. https://www.gov.uk/government/publications/sponsored-work-and-family-visa-earnings-
employment-and-income-tax/sponsored-work-and-family-visa-earnings-employment-and-
income-tax;https://www.theguardian.com/uk-news/2025/sep/14/what-do-the-immigration-
41
figures-for-the-uk-really-show
20. https://www.ons.gov.uk/peoplepopulationandcommunity/populationandmigration/
populationestimates/articles/milestonesjourneyingthroughmodernlife/2024-04-08
21. https://www.gov.uk/government/publications/migration-advisory-committee-annual-
report-2025/migration-advisory-committee-mac-annual-report-2025-accessible#chapter-1-
fiscal-analysis-of-the-family-visa
22. https://www.gov.uk/government/statistics/migrant-journey-2024-report
23. https://www.gov.uk/government/publications/migration-advisory-committee-annual-
report-2025/migration-advisory-committee-mac-annual-report-2025-accessible#chapter-1-
fiscal-analysis-of-the-family-visa
24. https://commonslibrary.parliament.uk/research-briefings/sn06724/
25. https://www.gov.uk/government/publications/family-visa-financial-requirements-review/
family-visa-financial-requirements-review-accessible#chapter-1-use-of-the-family-route
26. https://www.gov.uk/government/statistics/immigration-system-statistics-year-ending-
december-2025/how-many-people-claim-asylum-in-the-uk
27. The first former students settling from 2026 are precisely the cohort who entered in 2020,
completed short courses, and then moved onto the graduate route or another settlement track.
Excluding 2020 would undercount the earliest Boriswave student settlers. This is a feeder-
cohort model for 2026–2030 settlement, not a mechanical year-by-year lag table.
28. https://www.gov.uk/government/publications/graduate-route-rapid-review/graduate-route-
rapid-review-accessible
29. https://www.gov.uk/government/statistics/migrant-journey-2024-report/migrant-journey-
2024-report
30. https://commonslibrary.parliament.uk/research-briefings/sn01403/; https://www.gov.uk/
government/statistics/migrant-journey-2024-report/migrant-journey-2024-report
31. https://migrationobservatory.ox.ac.uk/wp-content/uploads/2023/10/2025-Briefing-Family-
migration-to-the-UK.pdf
32. https://dera.ioe.ac.uk/id/eprint/41300/1/Graduate%20route%20evaluation%20-%20GOV.pdf
33. https://migrationobservatory.ox.ac.uk/resources/briefings/hong-kong-bno-route/
34. https://www.ucl.ac.uk/ioe/departments-and-centres/quantitative-social-science/research/
hong-kong-bno-migrants-panel-survey
35. https://www.gov.uk/government/publications/survey-of-hong-kong-british-national-overseas-
visa-holders-2021
36. https://www.gov.uk/government/publications/migration-advisory-committee-annual-
report-2025/migration-advisory-committee-mac-annual-report-2025-accessible
37. https://www.gov.uk/government/consultations/earned-settlement/a-fairer-pathway-to-
settlement-statement-and-accompanying-consultation-on-earned-settlement-accessible
38. EU Settled Status will initially be protected but we intend to renegotiate the Citizens’ Rights
Chapter of the UK-EU Withdrawal Agreement to ensure reciprocity in access to welfare.
39. Exact salary thresholds will be determined based on net fiscal cost modelling close to the
general election.